In brief
- Manhattan is the most expensive US city, with living costs more than double the national average.
- Honolulu, San Jose and San Francisco rank second, third and fourth on the C2ER index.
- Three New York boroughs, Manhattan, Brooklyn and Queens, are in the top 10.
- Housing is the main factor behind high living costs in every city on the list.
As of October 2026, Manhattan is the most expensive city in the USA, with living costs more than double the national average, according to the Council for Community and Economic Research (C2ER). Honolulu, San Jose and San Francisco follow. Housing is the main reason these cities cost so much more than the rest of the country.
The C2ER Cost of Living Index compares prices across hundreds of US urban areas, with 100 as the national average. It covers housing, utilities, groceries, transport, healthcare and other goods and services. Its 2025 annual average, published in February 2026, covered 283 urban areas and again placed Manhattan first.
The table below uses the most recent full top 10 published by C2ER’s media partners (first quarter of 2024), with the second quarter of 2025 scores added where they were reported.
 Also readMost Expensive Chocolates in the World 2026: Top 9 Ranked
| Rank | City | Index, Q1 2024 | Index, Q2 2025 |
|---|---|---|---|
| 1 | Manhattan, New York | 231 | 232.0 |
| 2 | Honolulu, Hawaii | 186.2 | 182.1 |
| 3 | San Jose, California | 177.1 | 181.1 |
| 4 | San Francisco, California | 169.6 | 160.1 |
| 5 | Brooklyn, New York | 161.5 | 159.4 |
| 6 | Orange County, California | 154.9 | Not reported |
| 7 | Los Angeles, California | 150.6 | Not reported |
| 8 | Queens, New York | 146.9 | Not reported |
| 9 | Washington, D.C. | 144.6 | Not reported |
| 10 | Boston, Massachusetts | 144.3 | 144.8 |
1. Manhattan, New York: Index 231

Manhattan scored 231 in the first quarter of 2024 and about 232 in the second quarter of 2025, meaning living costs are more than twice the national average. It is about 24% more expensive than Honolulu, the second city on the list.
Housing drives most of the gap. Homes in the West Village have a median price of about $2,400 per square foot, and one-bedroom rents in the borough routinely exceed $4,000 a month.
New York City is also home to about 350,000 millionaires, the most of any US city, which keeps demand for property high.
2. Honolulu, Hawaii: Index 186.2
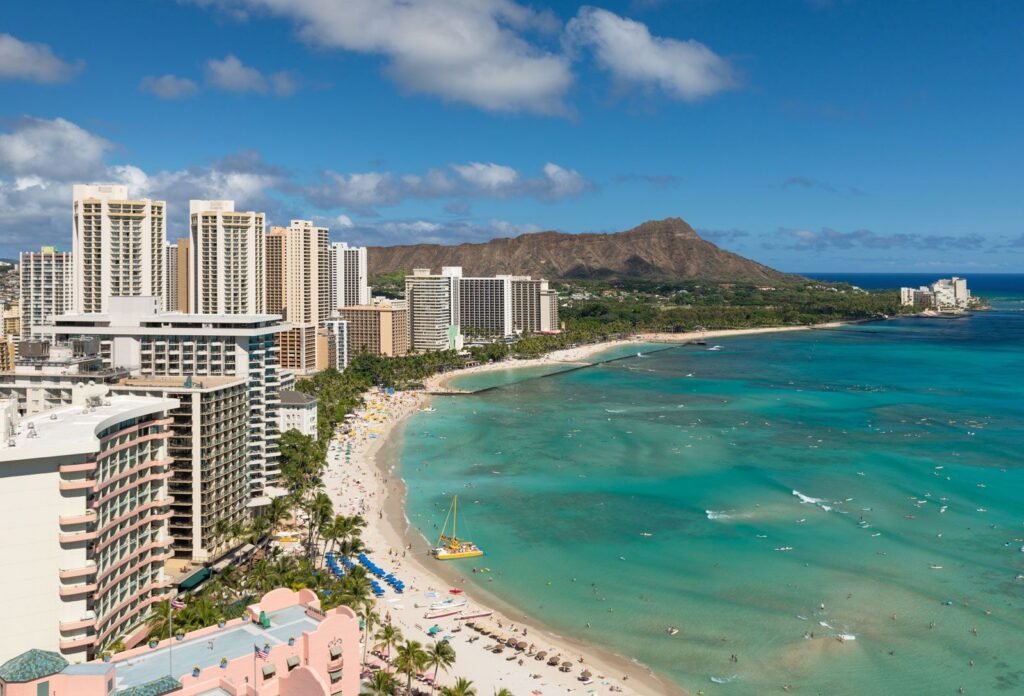
Honolulu scored 186.2 in early 2024 and 182.1 in mid-2025. Being on an island far from the mainland makes almost everything more expensive, because most food, fuel and consumer goods have to be shipped in.
Groceries and utilities in Honolulu cost far more than the US average. Limited land for new building also keeps house prices and rents high.
3. San Jose, California: Index 177.1

San Jose, at the centre of Silicon Valley, scored 177.1 in early 2024 and 181.1 in mid-2025, moving close to Honolulu. High-paying technology jobs have pushed up demand for housing across the area.
Median annual property tax bills in the San Jose area are about $9,500, among the highest in the country.
4. San Francisco, California: Index 169.6

San Francisco scored 169.6 in early 2024 and 160.1 in mid-2025. Its score has eased as office use and rents changed after the pandemic, but it remains one of the costliest places to live in the US.
The median home sale price in San Francisco was about $1.53 million in early 2026, and the average one-bedroom rent was around $3,450 a month.
5. Brooklyn, New York: Index 161.5

Brooklyn scored 161.5 in early 2024 and 159.4 in mid-2025. Prices in neighbourhoods close to Manhattan, such as Williamsburg, Park Slope and Brooklyn Heights, have risen sharply over the past two decades.
Many people who work in Manhattan live in Brooklyn for slightly lower rents, which keeps demand strong.
6. Orange County, California: Index 154.9

Orange County, south of Los Angeles, scored 154.9 in early 2024. It includes coastal cities such as Newport Beach, Laguna Beach and Irvine.
Limited housing supply and high demand for homes near the coast keep prices among the highest in Southern California.
7. Los Angeles, California: Index 150.6

The Los Angeles and Long Beach area scored 150.6 in early 2024. Housing costs are the main factor, along with high petrol prices and the cost of getting around a city built around cars.
Los Angeles has long had one of the tightest rental markets in the US.
8. Queens, New York: Index 146.9

Queens scored 146.9 in early 2024. It is New York City’s largest borough by area and is generally cheaper than Manhattan and Brooklyn, but still far above the national average.
Neighbourhoods with fast subway links to Manhattan, such as Long Island City and Astoria, have seen the largest price rises.
9. Washington, D.C.: Index 144.6

Washington, D.C. scored 144.6 in early 2024. A large share of jobs are with the federal government or companies that work with it, and salaries in the area are higher than average.
Housing in the city and nearby suburbs, including Arlington in Virginia, is the main reason for the high score.
10. Boston, Massachusetts: Index 144.3
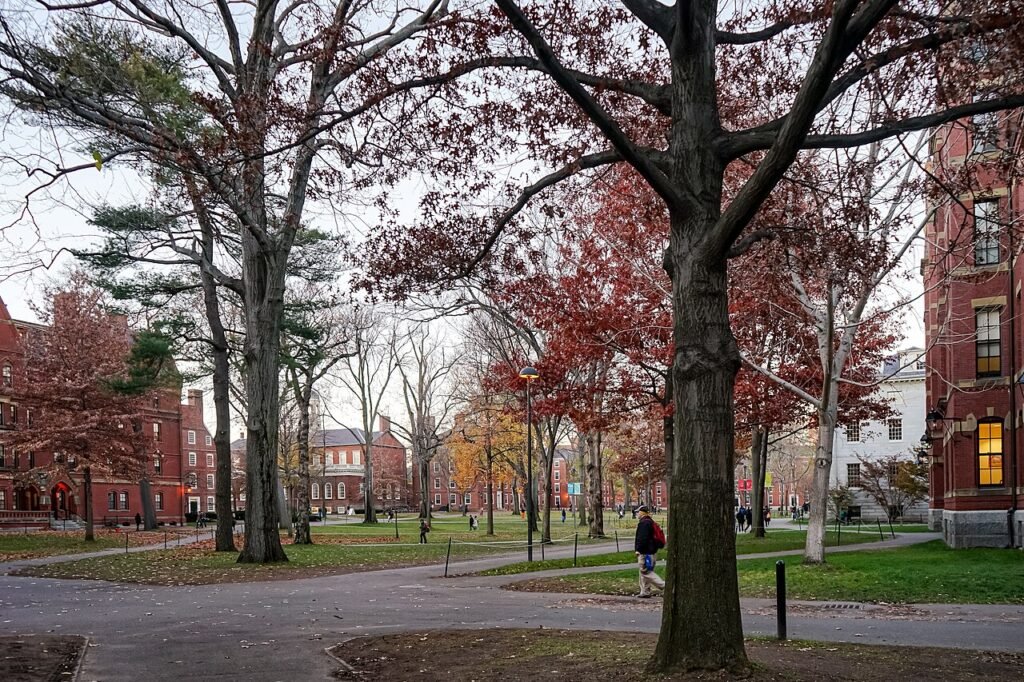
Boston scored 144.3 in early 2024 and 144.8 in mid-2025. Universities, hospitals and biotech companies attract well-paid workers and students, which pushes up rents.
Healthcare and food costs in Boston are also above the national average.
Cities that dropped out of the top 10
Earlier versions of this list included Oakland, Seattle and Arlington, Virginia. They remain expensive, but C2ER data now ranks other areas, including San Jose, Orange County and Los Angeles, above them.
At the other end of the scale, Decatur, Illinois, was the least expensive area in early 2024, at 22.2% below the national average. In the 2025 annual average, Tupelo, Mississippi, was the cheapest at more than 20% below average.
How we ranked these
We ranked cities by their composite score in the C2ER Cost of Living Index for the first quarter of 2024, the latest full top 10 we could confirm from published reporting. Where second quarter 2025 scores were reported, we added them for comparison.
The index measures prices for a professional household, not average incomes. A high score does not mean residents are worse off, since wages in these cities are usually higher too. For a global view, see our list of the wealthiest cities in the world.
Sources: C2ER 2025 annual average release, CNBC via NBC Philadelphia, Legal Clarity, citing C2ER Q2 2025.
Frequently asked questions
What is the most expensive city in the USA?
Manhattan, New York, is the most expensive city in the USA. It scored 231 on the C2ER Cost of Living Index in early 2024 and about 232 in mid-2025, meaning costs are more than double the national average. Housing is the biggest reason.
Which state has the most expensive cities?
California has the most cities in the top 10, with San Jose, San Francisco, Orange County and Los Angeles all ranked. New York follows with Manhattan, Brooklyn and Queens. Hawaii, Washington, D.C. and Massachusetts each have one city in the list.
How is the cost of living index calculated?
The C2ER Cost of Living Index compares prices of housing, utilities, groceries, transport, healthcare and other goods and services across US urban areas. A score of 100 is the national average, so a score of 150 means costs are 50% higher than average.
Is San Francisco more expensive than New York?
No. Manhattan is more expensive than San Francisco on the C2ER index. In mid-2025, Manhattan scored about 232, while San Francisco scored about 160. San Francisco is still one of the five most expensive places in the country.
What is the cheapest city in the USA?
In the C2ER 2025 annual average, Tupelo, Mississippi, was the least expensive urban area, at more than 20% below the national average. In early 2024, Decatur, Illinois, held that position at 22.2% below average.
See more Wealthy Garage stories on Google
Add us as a preferred source and our stories will show up more often in your Top Stories.
Add Wealthy Garage as a preferred source on Google